

Benchmarks

Measured, with the method attached

Numbers come from tool runs recorded in the repository, with the host and build they ran on. No number here is typed by hand.

  • 79 results
  • 10 machines
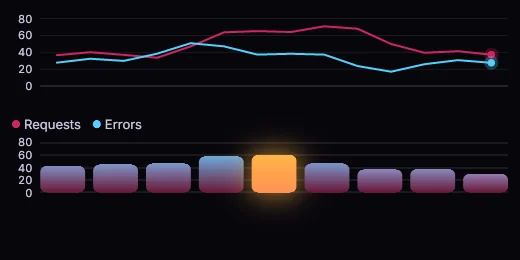
A charts scene drawn by AsterDrawn by Aster

Headline numbers

A few of the most telling results, each with the machine it ran on. Read them as noisy upper bounds: see how to read the numbers.

All 79 results

Read these numbers as noisy upper bounds

  1. 1

    The test machine is shared and was heavily loaded (load average above 100 on 96 threads) during every re-run. Wall times are inflated and noisy; CPU-time columns are less affected. Read re-run numbers as upper bounds, not tuned results.

  2. 2

    Each re-run is a single run (aster-perf: 5 repetitions), on a different day and commit than the recorded baselines. Do not compute speedups between re-run and recorded entries.

  3. 3

    Microbenchmarks are workload-specific. No application-level speedup is claimed.

  4. 4

    Native frame steps are single-threaded.

  5. 5

    aster-perf CPU time per frame comes from kernel tick accounting (resolution about 1 ms), so values near 1 to 2 ms are quantised. Phase totals in the full JSON report are exact.

Where each number ran

Every result names its machine. Click a tag in a table to jump here.

M1

AMD EPYC 7K62, 48 cores, 96 threads. Linux 7.0.0-42, rustc 1.98.0 in docker. Shared host, load average about 130-190.

16 results
M2

AMD EPYC 7K62, 48 cores, 96 threads. Linux 7.0.0-42, rustc 1.98.0 in docker. Shared host, load average about 130-190. Node v22.22.1

8 results
M3

Not machine-specific: the size of a built file

1 result
M4

AMD EPYC 7K62, 48 cores. 96 CPUs of container quota (96 on host), kernel 7.0.0-42-generic, in docker. Load average 200.52 at start.

30 results
M5

AMD Ryzen 7 7840HS with Radeon 780M graphics, 16 CPUs

10 results
M6

AMD EPYC 7K62, 48 cores. Linux sandbox with 8 CPUs of quota, kernel 7.0.0-38. Load average about 90 (heavily loaded).

10 results
M7

Linux test machine, headless, 5 runs

1 result
M8

Linux test machine, headless

1 result
M9

See the linked record (fixed executables, reversed-order runs)

1 result
M10

See the linked record

1 result

All 79 results

Grouped by what was measured, each group collapsed. Open one to read its table.

  • rerunmeasured again for this site
  • recordedcopied from a repository record with its own machine and date

native frame step

16 resultsmachine M1
rerun

rerunmachine M1web/README.md

CaseResultp99Frames
static @ 1080p-1xmedian time of one scripted 16 ms step of the native single-threaded renderer, 60 steps; changed steps: 0 of 60; nothing changed, so this is the idle-step cost, not a render
Command
shell
aster-web-oracle --workload all --size 1080p-1x,1080p-2x --frames 60 (web/, release build)
0.002 ms0.003 ms60
static @ 1080p-2xmedian time of one scripted 16 ms step of the native single-threaded renderer, 60 steps; changed steps: 0 of 60; nothing changed, so this is the idle-step cost, not a render
Command
shell
aster-web-oracle --workload all --size 1080p-1x,1080p-2x --frames 60 (web/, release build)
0.002 ms0.004 ms60
hover @ 1080p-1xmedian time of one scripted 16 ms step of the native single-threaded renderer, 60 steps; changed steps: 60 of 60
Command
shell
aster-web-oracle --workload all --size 1080p-1x,1080p-2x --frames 60 (web/, release build)
2.455 ms4.545 ms60
hover @ 1080p-2xmedian time of one scripted 16 ms step of the native single-threaded renderer, 60 steps; changed steps: 60 of 60
Command
shell
aster-web-oracle --workload all --size 1080p-1x,1080p-2x --frames 60 (web/, release build)
3.762 ms10.156 ms60
type @ 1080p-1xmedian time of one scripted 16 ms step of the native single-threaded renderer, 60 steps; changed steps: 60 of 60
Command
shell
aster-web-oracle --workload all --size 1080p-1x,1080p-2x --frames 60 (web/, release build)
2.017 ms5.951 ms60
type @ 1080p-2xmedian time of one scripted 16 ms step of the native single-threaded renderer, 60 steps; changed steps: 60 of 60
Command
shell
aster-web-oracle --workload all --size 1080p-1x,1080p-2x --frames 60 (web/, release build)
2.47 ms13.906 ms60
scroll @ 1080p-1xmedian time of one scripted 16 ms step of the native single-threaded renderer, 60 steps; changed steps: 60 of 60
Command
shell
aster-web-oracle --workload all --size 1080p-1x,1080p-2x --frames 60 (web/, release build)
17.376 ms32.851 ms60
scroll @ 1080p-2xmedian time of one scripted 16 ms step of the native single-threaded renderer, 60 steps; changed steps: 60 of 60
Command
shell
aster-web-oracle --workload all --size 1080p-1x,1080p-2x --frames 60 (web/, release build)
22.181 ms43.477 ms60
fluid @ 1080p-1xmedian time of one scripted 16 ms step of the native single-threaded renderer, 60 steps; changed steps: 60 of 60
Command
shell
aster-web-oracle --workload all --size 1080p-1x,1080p-2x --frames 60 (web/, release build)
36.75 ms40.887 ms60
fluid @ 1080p-2xmedian time of one scripted 16 ms step of the native single-threaded renderer, 60 steps; changed steps: 60 of 60
Command
shell
aster-web-oracle --workload all --size 1080p-1x,1080p-2x --frames 60 (web/, release build)
38.118 ms39.449 ms60
theme-fade @ 1080p-1xmedian time of one scripted 16 ms step of the native single-threaded renderer, 60 steps; changed steps: 50 of 60
Command
shell
aster-web-oracle --workload all --size 1080p-1x,1080p-2x --frames 60 (web/, release build)
12.479 ms55.772 ms60
theme-fade @ 1080p-2xmedian time of one scripted 16 ms step of the native single-threaded renderer, 60 steps; changed steps: 50 of 60
Command
shell
aster-web-oracle --workload all --size 1080p-1x,1080p-2x --frames 60 (web/, release build)
12.444 ms54.743 ms60
charts @ 1080p-1xmedian time of one scripted 16 ms step of the native single-threaded renderer, 60 steps; changed steps: 60 of 60
Command
shell
aster-web-oracle --workload all --size 1080p-1x,1080p-2x --frames 60 (web/, release build)
21.5 ms24.336 ms60
charts @ 1080p-2xmedian time of one scripted 16 ms step of the native single-threaded renderer, 60 steps; changed steps: 60 of 60
Command
shell
aster-web-oracle --workload all --size 1080p-1x,1080p-2x --frames 60 (web/, release build)
41.642 ms48.793 ms60
cinematic @ 1080p-1xmedian time of one scripted 16 ms step of the native single-threaded renderer, 60 steps; changed steps: 60 of 60
Command
shell
aster-web-oracle --workload all --size 1080p-1x,1080p-2x --frames 60 (web/, release build)
0.344 ms1.888 ms60
cinematic @ 1080p-2xmedian time of one scripted 16 ms step of the native single-threaded renderer, 60 steps; changed steps: 60 of 60
Command
shell
aster-web-oracle --workload all --size 1080p-1x,1080p-2x --frames 60 (web/, release build)
0.392 ms2.033 ms60

wasm simd128 frame step under Node

8 resultsmachine M2
rerun

rerunmachine M2web/README.md

median wall time of one scripted frame step in the wasm simd128 module under Node 22 (V8), pooled over 3 fresh instances x 240 frames

CaseResult
hover @ 1920x1080@1
Command
shell
node web/tools/bench-wasm.mjs --wasm aster_web.simd128.wasm --at 1920x1080@1 --json
2.682 ms
type @ 1920x1080@1
Command
shell
node web/tools/bench-wasm.mjs --wasm aster_web.simd128.wasm --at 1920x1080@1 --json
1.979 ms
scroll @ 1920x1080@1
Command
shell
node web/tools/bench-wasm.mjs --wasm aster_web.simd128.wasm --at 1920x1080@1 --json
23.748 ms
fluid @ 1920x1080@1
Command
shell
node web/tools/bench-wasm.mjs --wasm aster_web.simd128.wasm --at 1920x1080@1 --json
82.231 ms
theme-fade @ 1920x1080@1
Command
shell
node web/tools/bench-wasm.mjs --wasm aster_web.simd128.wasm --at 1920x1080@1 --json
6.763 ms
charts @ 1920x1080@1
Command
shell
node web/tools/bench-wasm.mjs --wasm aster_web.simd128.wasm --at 1920x1080@1 --json
27.379 ms
cinematic @ 1920x1080@1
Command
shell
node web/tools/bench-wasm.mjs --wasm aster_web.simd128.wasm --at 1920x1080@1 --json
0.202 ms
sweep @ 1920x1080@1
Command
shell
node web/tools/bench-wasm.mjs --wasm aster_web.simd128.wasm --at 1920x1080@1 --json
0.928 ms

wasm module size

1 resultmachine M3
rerun

rerunmachine M3web/README.md

size of the wasm module

CaseResult
simd128
Command
shell
web/tools/build-wasm.sh simd128
9,887,547 bytes

aster-perf scenarios

30 resultsmachine M4
rerun

rerunmachine M4docs/perf/MEASURE-r1.md

CaseResultFrames
docs: first framea docs site: 10,000 pages in the sidebar, a long article, a search box - time to first frame
Command
shell
aster-perf run all --reps 5 (rust/, release, native-fonts)
38.56 ms–
docs: peak RSSpeak resident set size of the scenario process
Command
shell
aster-perf run all --reps 5
67,484 KiB–
docs: scroll CPU time per framemedian CPU time of the thread that drew one frame during the scroll phase (60 frames); p95 in p95_ms
Command
shell
aster-perf run all --reps 5
2 ms60
docs: hover CPU time per framemedian CPU time of the thread that drew one frame during the hover phase (21 frames); p95 in p95_ms
Command
shell
aster-perf run all --reps 5
2 ms21
docs: typing CPU time per framemedian CPU time of the thread that drew one frame during the typing phase (6 frames); p95 in p95_ms
Command
shell
aster-perf run all --reps 5
7 ms6
docs: transition CPU time per framemedian CPU time of the thread that drew one frame during the transition phase (20 frames); p95 in p95_ms
Command
shell
aster-perf run all --reps 5
2.408 ms20
dashboard: first framethe ops dashboard: live charts, stat tiles, an event log, a settings drawer - time to first frame
Command
shell
aster-perf run all --reps 5 (rust/, release, native-fonts)
109.42 ms–
dashboard: peak RSSpeak resident set size of the scenario process
Command
shell
aster-perf run all --reps 5
211,892 KiB–
dashboard: idle CPU time per framemedian CPU time of the thread that drew one frame during the idle phase (120 frames); p95 in p95_ms
Command
shell
aster-perf run all --reps 5
2.208 ms120
dashboard: scroll CPU time per framemedian CPU time of the thread that drew one frame during the scroll phase (40 frames); p95 in p95_ms
Command
shell
aster-perf run all --reps 5
1.001 ms40
dashboard: hover CPU time per framemedian CPU time of the thread that drew one frame during the hover phase (23 frames); p95 in p95_ms
Command
shell
aster-perf run all --reps 5
5 ms23
dashboard: typing CPU time per framemedian CPU time of the thread that drew one frame during the typing phase (6 frames); p95 in p95_ms
Command
shell
aster-perf run all --reps 5
6.774 ms6
dashboard: transition CPU time per framemedian CPU time of the thread that drew one frame during the transition phase (25 frames); p95 in p95_ms
Command
shell
aster-perf run all --reps 5
15.828 ms25
list: first framea records browser: 10,000 virtualised rows and a detail pane - time to first frame
Command
shell
aster-perf run all --reps 5 (rust/, release, native-fonts)
68.21 ms–
list: peak RSSpeak resident set size of the scenario process
Command
shell
aster-perf run all --reps 5
369,380 KiB–
list: scroll CPU time per framemedian CPU time of the thread that drew one frame during the scroll phase (60 frames); p95 in p95_ms
Command
shell
aster-perf run all --reps 5
4.686 ms60
list: hover CPU time per framemedian CPU time of the thread that drew one frame during the hover phase (14 frames); p95 in p95_ms
Command
shell
aster-perf run all --reps 5
0.839 ms14
list: typing CPU time per framemedian CPU time of the thread that drew one frame during the typing phase (3 frames); p95 in p95_ms
Command
shell
aster-perf run all --reps 5
0.284 ms3
list: transition CPU time per framemedian CPU time of the thread that drew one frame during the transition phase (20 frames); p95 in p95_ms
Command
shell
aster-perf run all --reps 5
0.823 ms20
settings: first framea settings form: text field, switches, a select, a slider, a dialog - time to first frame
Command
shell
aster-perf run all --reps 5 (rust/, release, native-fonts)
48.03 ms–
settings: peak RSSpeak resident set size of the scenario process
Command
shell
aster-perf run all --reps 5
391,676 KiB–
settings: scroll CPU time per framemedian CPU time of the thread that drew one frame during the scroll phase (40 frames); p95 in p95_ms
Command
shell
aster-perf run all --reps 5
2.88 ms40
settings: hover CPU time per framemedian CPU time of the thread that drew one frame during the hover phase (7 frames); p95 in p95_ms
Command
shell
aster-perf run all --reps 5
1 ms7
settings: typing CPU time per framemedian CPU time of the thread that drew one frame during the typing phase (3 frames); p95 in p95_ms
Command
shell
aster-perf run all --reps 5
4.442 ms3
settings: transition CPU time per framemedian CPU time of the thread that drew one frame during the transition phase (15 frames); p95 in p95_ms
Command
shell
aster-perf run all --reps 5
14.304 ms15
cold_text: first framea text-heavy document: the cold first frame of a screen full of prose - time to first frame
Command
shell
aster-perf run all --reps 5 (rust/, release, native-fonts)
2,008.86 ms–
cold_text: peak RSSpeak resident set size of the scenario process
Command
shell
aster-perf run all --reps 5
391,676 KiB–
cold_text: scroll CPU time per framemedian CPU time of the thread that drew one frame during the scroll phase (40 frames); p95 in p95_ms
Command
shell
aster-perf run all --reps 5
13.999 ms40
cold_text: typing CPU time per framemedian CPU time of the thread that drew one frame during the typing phase (3 frames); p95 in p95_ms
Command
shell
aster-perf run all --reps 5
11.87 ms3
cold_text: transition CPU time per framemedian CPU time of the thread that drew one frame during the transition phase (13 frames); p95 in p95_ms
Command
shell
aster-perf run all --reps 5
9.056 ms13

aster-perf scenarios (baseline 7)

10 resultsmachine M5
recorded

recordedmachine M5docs/perf/baselines/aster-perf-laptop-7840hs-20261107.json

CaseResultFrames
docs: scroll CPU time per framemedian CPU time of one frame in the scroll phase, recorded in the repository baseline
Command
shell
aster-perf run all --reps 5 (as recorded in the baseline file)
1 ms60
docs: typing CPU time per framemedian CPU time of one frame in the typing phase, recorded in the repository baseline
Command
shell
aster-perf run all --reps 5 (as recorded in the baseline file)
5.002 ms6
dashboard: scroll CPU time per framemedian CPU time of one frame in the scroll phase, recorded in the repository baseline
Command
shell
aster-perf run all --reps 5 (as recorded in the baseline file)
1 ms40
dashboard: typing CPU time per framemedian CPU time of one frame in the typing phase, recorded in the repository baseline
Command
shell
aster-perf run all --reps 5 (as recorded in the baseline file)
4.495 ms6
list: scroll CPU time per framemedian CPU time of one frame in the scroll phase, recorded in the repository baseline
Command
shell
aster-perf run all --reps 5 (as recorded in the baseline file)
2.562 ms60
list: typing CPU time per framemedian CPU time of one frame in the typing phase, recorded in the repository baseline
Command
shell
aster-perf run all --reps 5 (as recorded in the baseline file)
0 ms3
settings: scroll CPU time per framemedian CPU time of one frame in the scroll phase, recorded in the repository baseline
Command
shell
aster-perf run all --reps 5 (as recorded in the baseline file)
1.928 ms40
settings: typing CPU time per framemedian CPU time of one frame in the typing phase, recorded in the repository baseline
Command
shell
aster-perf run all --reps 5 (as recorded in the baseline file)
4 ms3
cold_text: scroll CPU time per framemedian CPU time of one frame in the scroll phase, recorded in the repository baseline
Command
shell
aster-perf run all --reps 5 (as recorded in the baseline file)
64.951 ms40
cold_text: typing CPU time per framemedian CPU time of one frame in the typing phase, recorded in the repository baseline
Command
shell
aster-perf run all --reps 5 (as recorded in the baseline file)
62.888 ms3

aster-perf scenarios (baseline EPYC 7K62)

10 resultsmachine M6
recorded

recordedmachine M6docs/perf/baselines/aster-perf-linux-x86_64-20261107.json

CaseResultFrames
docs: scroll CPU time per framemedian CPU time of one frame in the scroll phase, recorded in the repository baseline
Command
shell
aster-perf run all --reps 5 (as recorded in the baseline file)
2 ms60
docs: typing CPU time per framemedian CPU time of one frame in the typing phase, recorded in the repository baseline
Command
shell
aster-perf run all --reps 5 (as recorded in the baseline file)
9 ms6
dashboard: scroll CPU time per framemedian CPU time of one frame in the scroll phase, recorded in the repository baseline
Command
shell
aster-perf run all --reps 5 (as recorded in the baseline file)
1 ms40
dashboard: typing CPU time per framemedian CPU time of one frame in the typing phase, recorded in the repository baseline
Command
shell
aster-perf run all --reps 5 (as recorded in the baseline file)
5.296 ms6
list: scroll CPU time per framemedian CPU time of one frame in the scroll phase, recorded in the repository baseline
Command
shell
aster-perf run all --reps 5 (as recorded in the baseline file)
2.87 ms60
list: typing CPU time per framemedian CPU time of one frame in the typing phase, recorded in the repository baseline
Command
shell
aster-perf run all --reps 5 (as recorded in the baseline file)
0.999 ms3
settings: scroll CPU time per framemedian CPU time of one frame in the scroll phase, recorded in the repository baseline
Command
shell
aster-perf run all --reps 5 (as recorded in the baseline file)
2.716 ms40
settings: typing CPU time per framemedian CPU time of one frame in the typing phase, recorded in the repository baseline
Command
shell
aster-perf run all --reps 5 (as recorded in the baseline file)
5.999 ms3
cold_text: scroll CPU time per framemedian CPU time of one frame in the scroll phase, recorded in the repository baseline
Command
shell
aster-perf run all --reps 5 (as recorded in the baseline file)
80.91 ms40
cold_text: typing CPU time per framemedian CPU time of one frame in the typing phase, recorded in the repository baseline
Command
shell
aster-perf run all --reps 5 (as recorded in the baseline file)
80.516 ms3

Linux host present

2 resultsmachine M7, M8
recorded

recordedmachine M7, M8docs/perf/LINUX-r1.md

CaseResultMachine
whole 2560x1440 surfaceCPU time to convert and present one full frame, after the damage-limited present change (before: 4,499,946 ns)
Command
shell
benchmarks/native_present_profile
2,500,163 ns (p50)M7
caret-sized damage (2x24)CPU time to present a frame whose damage is a caret
Command
shell
benchmarks/native_present_profile
134 ns (p50)M8

Scene damage

1 resultmachine M9
recorded

recordedmachine M9docs/1.0/SCENE-DAMAGE.md

reduction in dense-scene edit+render time with exact primitive damage, synthetic fixture (not an application speedup)

CaseResult
dense edit time reduction vs full repaint
Command
shell
see document
93 % lower, desktop (87% phone)

workspace test passes

1 resultmachine M10
recorded

recordedmachine M10docs/1.0/PERFORMANCE-RELEASE-20261105.md

native-feature workspace, all targets, offline and locked

CaseResult
resource release
Command
shell
cargo test --workspace --all-targets --features native-fonts (as recorded)
4,089 passes (10 ignored)

Generated 2026-11-11.

How the list was chosen

Entries marked rerun were measured on 2026-11-11 on the machine named in each entry. Everything produced by the repository's own harnesses is included, with no entries dropped for being slow: all 16 native frame-step series (8 workloads x 2 sizes), all wasm workloads, and every aster-perf scenario and phase that drew frames (idle and zero-frame phases are omitted because they report no per-frame figure). Entries marked recorded are copied from the named repository document or baseline file (with their own machine and date); for the baseline files only the scroll and typing phases are listed, which is a selection made to keep the list short, and the files contain the rest.

Try it yourself

The quick start has a screen running in minutes.